


Business Intelligence Forecasting and Decision-Making Explained
Suppose you are trying to predict the weather for this coming weekend. You will dig through historical weather reports, observe the patterns, and probably check an app. This is what businesses do when they want to plan for the future, but instead of the weather, they use business intelligence forecasting.
Business Intelligence helps businesses make good decisions by looking back at historical data to see the patterns it reveals. It's the same as having the power of foresight, but instead of magic, it uses data visualization, predictive analytics, and time series analysis to give a meaningful interpretation of numbers. Through advanced forecasting techniques and tools like Power BI, business organizations can plan, be prepared for any surprises, and do it with a competitive edge.
In this blog article, we will find out how BI and visualization work in forecasting for business.
The Role of Data Visualization in Predictive Analytics
If an enormous pile of numbers, reports, and spreadsheets can sometimes be exhausting, it is also the most skilfully woven, tentatively connected, and extraordinarily responsive story out there. This is the essence of data visualization. This is an extremely important factor that helps in predictive analytics and forecasting, and provides aid to businesses in making better decisions. Let's discuss its significance.
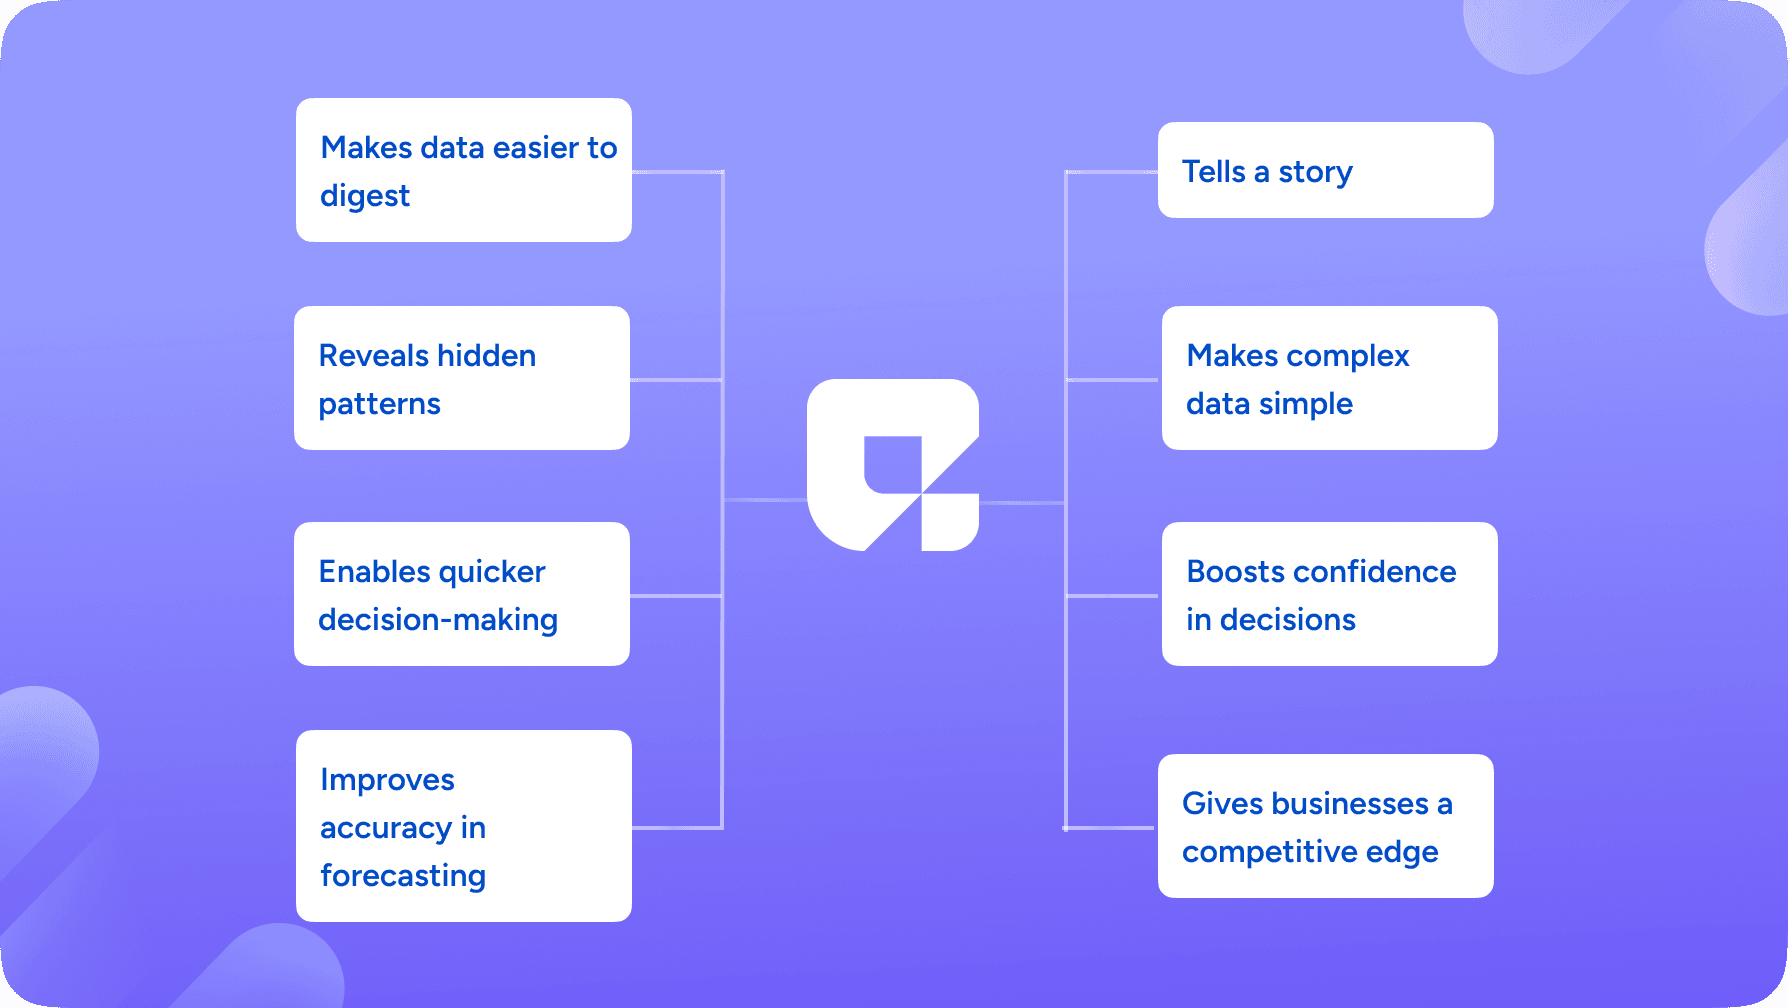
1. Makes data easier to digest
Imagine trying to put together a massive puzzle without an image to guide you. It is what raw data may seem likening. However, when you start creating a graph out of these numbers, puzzles begin to fit. Business Intelligence tools like Power BI help enterprises with unmanageable data, transform them for easy understanding; patterns, trends, and insights become evident immediately instead of looking through thousands of numbers.
2. Reveals hidden patterns
Some things become negligible when plunged into numbers. But data visualizations provide a clear view of hidden trends. An excellent example is time-series analysis. It gives a free hand to enterprises to track change over time, such as sales numbers in summer or consumer behaviors during festivals. With the right visuals, companies can discern patterns they had never noticed before and utilize that information to make smarter decisions.
3. Enables quicker decision-making
Have you ever experienced indecisiveness in making a choice because of information overload? The same problem is faced by businesses. When data stays dispersed, the completion of a decision takes forever. But an easy visual representation clears the clouds of indecision in a moment. BI systems help businesses see what is going on in real-time so that they can take action immediately instead of being stuck in analysis paralysis.
4. Improves accuracy in forecasting
Making business decisions based on gut feelings is risky. That is why companies use advanced forecasting tools to predict what is coming next. With platforms like Power BI and Questera, businesses can analyze past data, spot trends early, and make accurate forecasts. This helps them avoid costly mistakes, like ordering too much inventory or launching a marketing campaign at the wrong time.
5. Tells a story
Data is not just numbers on a screen, it tells a story. Every dip and rise in a graph represents something important. AI Agent GIA is great at turning raw data into meaningful insights, helping businesses understand what is happening and why. Instead of drowning in numbers, companies get a clear story that helps them take action with confidence through business intelligence forecasting.
6. Makes complex data simple
Think of data like a big city. If you do not have a map, you will get lost. But with a good map, you can find your way easily. That is what data visualization does for business information. It takes complicated data and presents it in a way that is simple and easy to follow. Whether it is a heat map, a bar chart, or a trend line, these visuals act as a guide that helps businesses stay on track when using business intelligence forecasting.
7. Boosts confidence in decisions
When data is clear, decision-making is no longer a guessing game. A company that can see exactly what is happening will feel much more confident in the choices they make. There is no need to second-guess or wonder if they are making the right move—BI systems provide solid proof and support every decision with facts.
8. Gives businesses a competitive edge
In business, staying ahead of the competition is everything. Companies that use predictive analytics and advanced forecasting with Questera have a major advantage. They can see trends before their competitors do, adjust their strategies early, and always be one step ahead. In a world where timing is everything, this kind of foresight is priceless, especially when leveraging business intelligence forecasting.
People also read: The Future of AI in Marketing and Business Intelligence
Leveraging Power BI for Advanced Forecasting
Perhaps the next great sales trend will be predictable, or at least one would know the best times to restock one's inventory. Advanced forecasting comes into play here, and Power BI is one of the best tools for the job. Complete with powerful features that ease the process of business intelligence, data visualization, and predictive analysis.
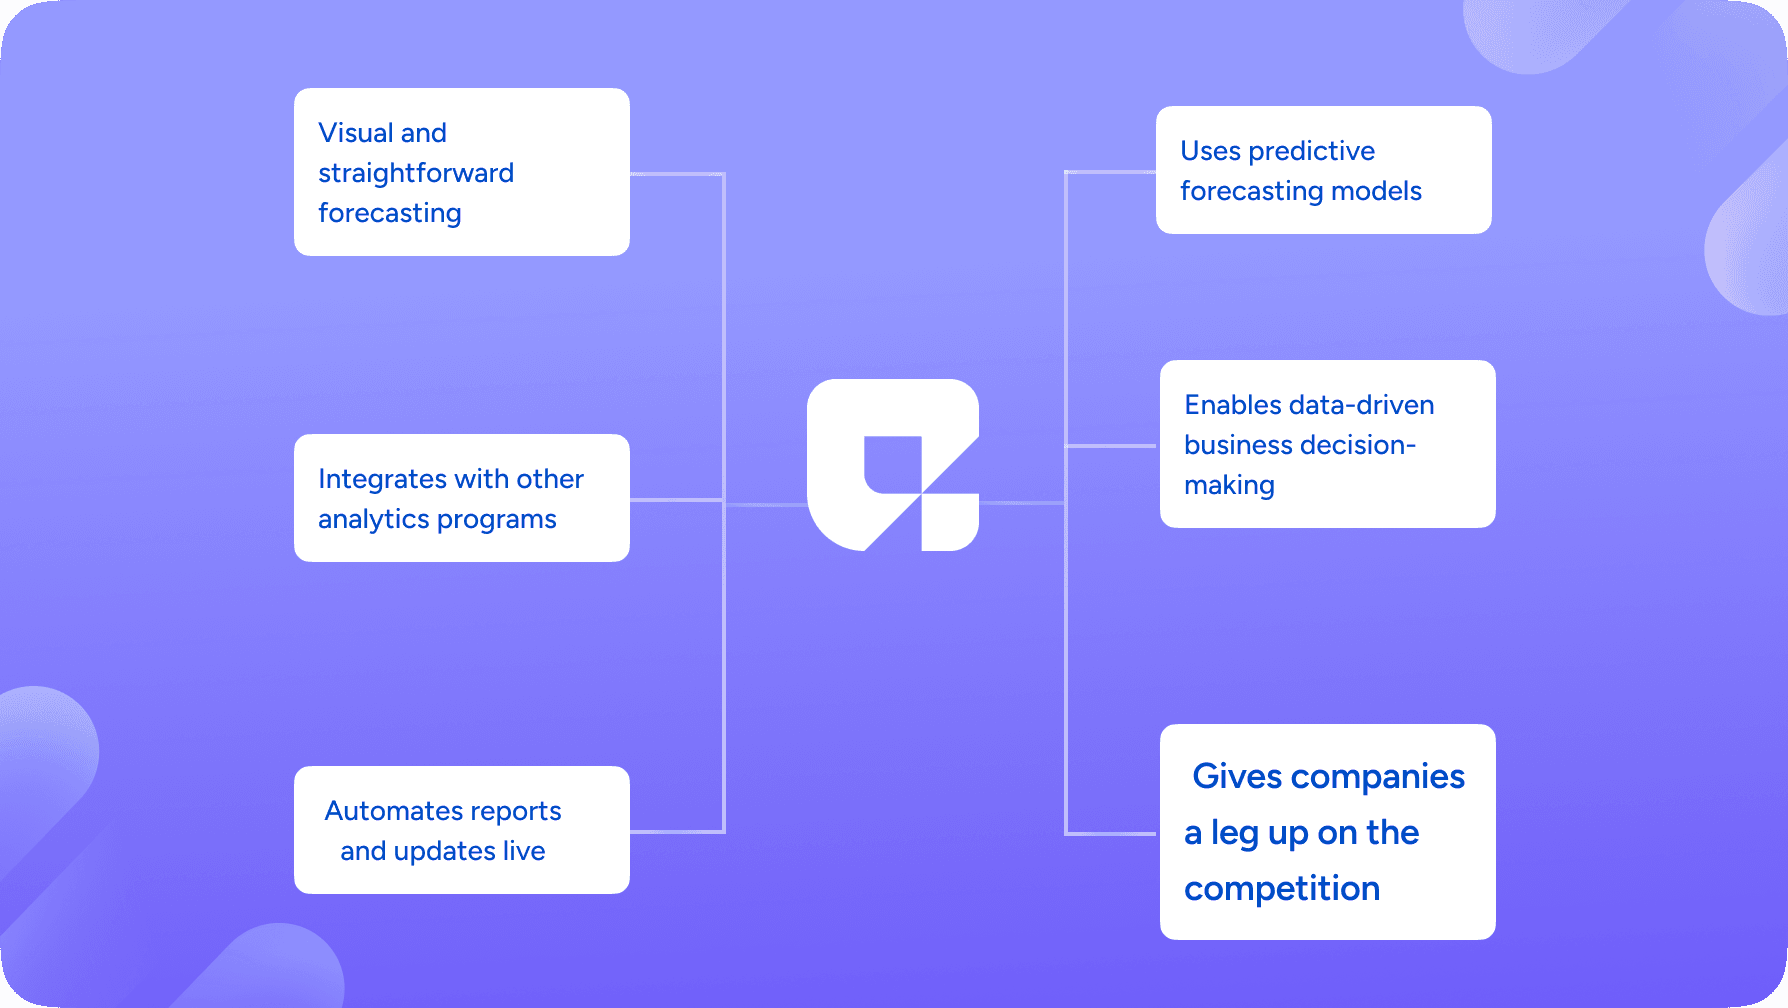
1. Visual and straightforward forecasting
Numbers can sometimes make little sense, but they serve as the foundation to create easy-to-read graphics with Power BI. Instead of guessing what the future might hold, businesses can literally watch trends unfold through data visualization. Having a clear idea always makes it easier to make decisions.
2. Uses predictive forecasting models
Power BI does not only analyze historical data, it predicts the next steps. The time series analysis gives information on patterns in sales, customer behavior, and market trends as an imaginary crystal ball, only much more reliable with business intelligence forecasting.
3. Integrates with other analytics programs
Power BI plays well with others. Integration with tools like Questera, Google Analytics, and Excel ensures that businesses have all the data they need in one place. The more data, the better the predictions in business intelligence forecasting.
4. Enables data-driven business decision-making
There's no space for intuition simply because Power BI does not call for it. It allows businesses to rely on hard-hitting numbers, be it estimating or planning for a marketing program or putting adjustments with an inventory model. Lesser mistakes, better decisions with business intelligence forecasting.
5. Automates reports and updates live
No one wants to look into real-time data. Reports are automatically updated by Power BI for the live data to be good enough to work on. Understanding real-time lets them change the course of a plan if a hiccup arises, utilizing business intelligence forecasting.
6. Gives companies a leg up on the competition
Business Intelligence systems like Power BI give a competitive edge to businesses, as they build a different view of trends a bit earlier than competitors. Advanced forecasting lets the businesses plan better and react accordingly using business intelligence forecasting.
GIA: Questera Agent
Alright, now that we have talked about how Power BI helps with advanced forecasting, let’s take it a step further. What if you had an intelligent assistant who could not only analyze massive amounts of data but also turn it into easy-to-understand graphs and reports? That is exactly what AI Agent GIA does.
How does GIA Work?
Imagine you have a pile of raw data sitting in different places- spreadsheets, databases, analytics tools. Instead of spending hours trying to make sense of it all, you just ask GIA a question. She pulls the right data from sources like Snowflake, Mixpanel, Tableau, and Looker, runs an in-depth data analysis, spots patterns using time series analysis, and then presents everything in a clear visual report. No more staring at endless numbers. You get charts, graphs, and dashboards that actually make sense.
Why is GIA the Best?
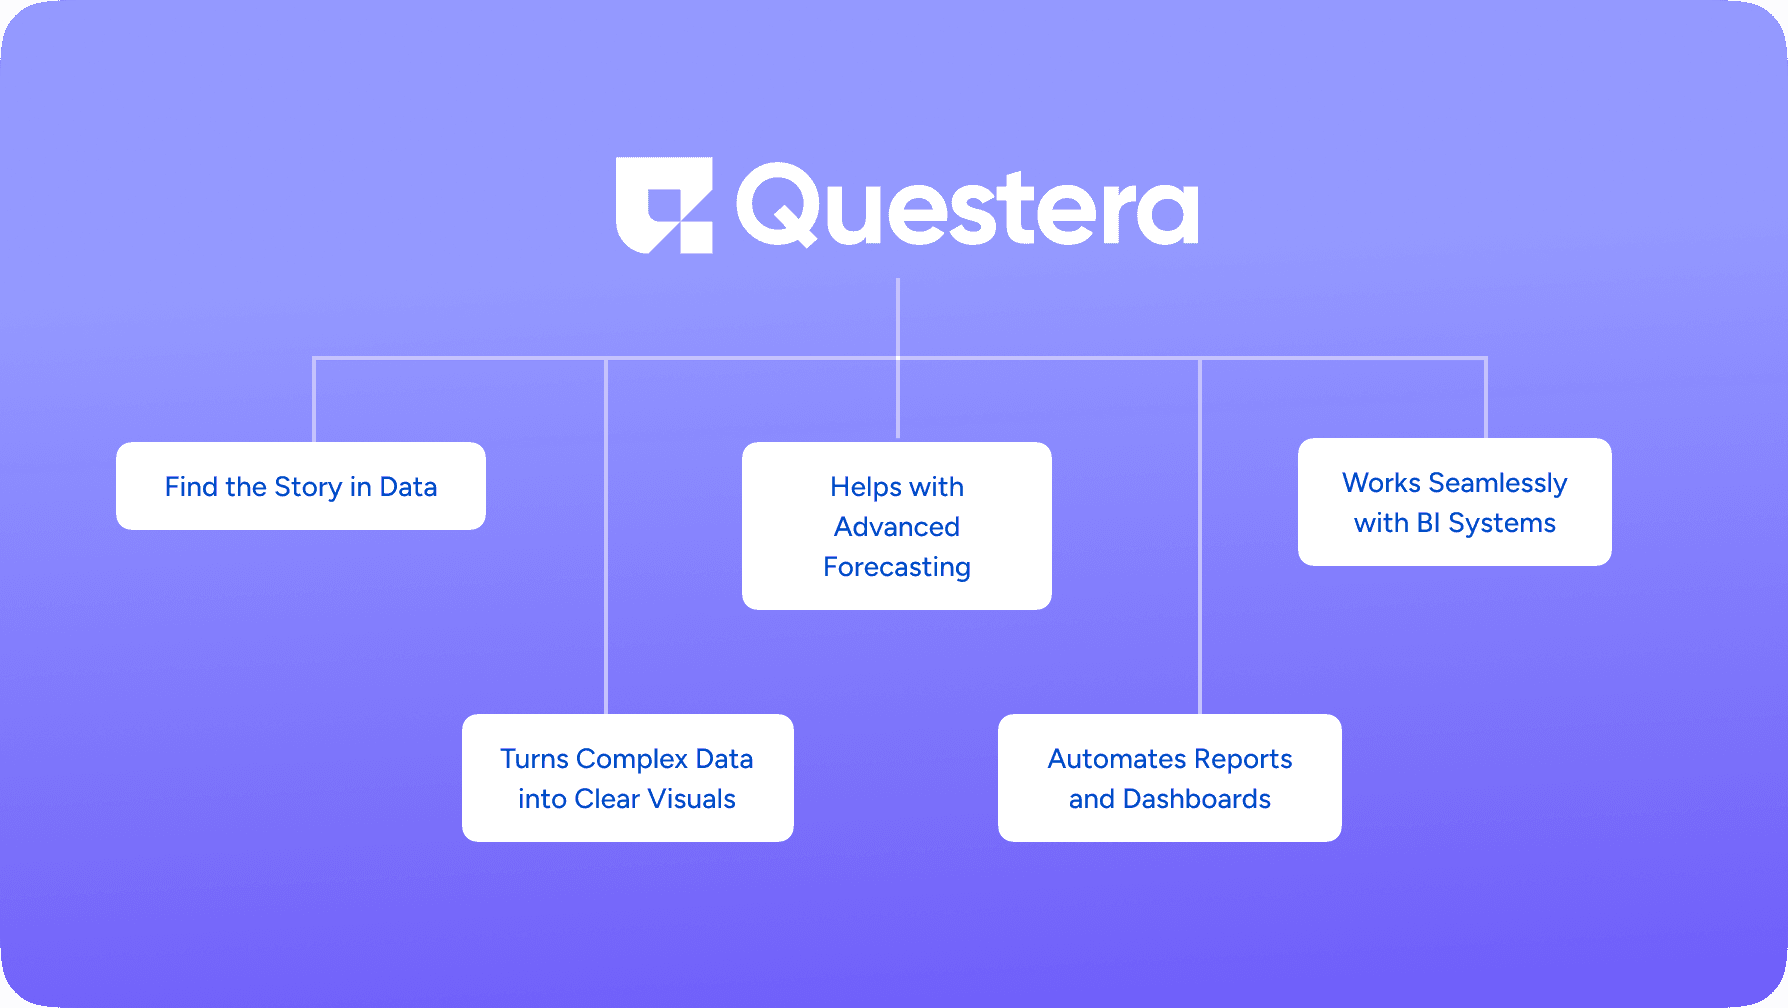
- Find the Story in Data: Data is not just a bunch of numbers. It tells a story about customer behavior, sales trends, and business performance. GIA helps uncover that story so companies can make better decisions.
- Turns Complex Data into Clear Visuals: Whether it is a bar chart, heatmap, or line graph, GIA makes sure that even the most complicated data is easy to understand. No more scratching your head over spreadsheets.
- Helps with Advanced Forecasting: GIA does not just show past trends, she predicts what is coming next. By analyzing patterns, she helps businesses prepare for future demand, spot risks early, and plan smarter strategies, all through business intelligence forecasting.
- Automates Reports and Dashboards: Instead of manually creating reports every week, businesses can let GIA do the work. She updates dashboards in real time, so decision-makers always have fresh insights in business intelligence forecasting.
- Works Seamlessly with BI Systems: GIA integrates with tools like Power BI, making sure that businesses can easily combine her insights with other BI systems to get the full picture.
Frequently Asked Questions (FAQs)
1. What is business intelligence forecasting?
Business intelligence forecasting is the process of using data analysis, predictive models, and visualization tools to predict future trends and outcomes in business. It helps organizations make informed decisions by leveraging historical data and patterns.
2. Why is data visualization important in business intelligence forecasting?
Data visualization transforms complex data into easy-to-understand visuals like graphs, charts, and dashboards. This helps businesses quickly identify trends, patterns, and anomalies, enabling faster and more accurate decision-making.
3. How does Power BI support business forecasting?
Power BI supports business forecasting by offering tools for time-series analysis, predictive modeling, real-time data tracking, and seamless integration with other analytics platforms. It helps convert raw data into visual reports that drive strategic planning.
4. What is time series analysis and how is it used in forecasting?
Time series analysis involves analyzing data points collected or recorded at specific time intervals. It helps identify trends, seasonality, and patterns over time, which are crucial for accurate forecasting in areas like sales, inventory, and customer behavior.
5. Who is GIA and how does she help with forecasting?
GIA is Questera’s AI-powered data analysis agent. She pulls data from various sources, applies advanced analytics like time series forecasting, and presents insights in easy-to-understand visuals. GIA helps businesses uncover stories in data and make data-driven decisions faster.
6. Can small businesses benefit from business intelligence forecasting?
Yes, small businesses can greatly benefit. BI forecasting helps them allocate resources efficiently, plan better for future demand, and stay competitive by reacting quickly to market changes with the help of tools like Power BI and agents like GIA.
7. What industries benefit most from business intelligence forecasting?
Industries such as retail, finance, healthcare, manufacturing, and e-commerce benefit the most. Forecasting helps these sectors manage inventory, optimize marketing efforts, reduce costs, and anticipate customer needs more effectively.
8. Is forecasting with BI tools better than traditional methods?
Yes. BI tools offer more accuracy, real-time data integration, and visual insights compared to traditional forecasting methods. They reduce human error, automate updates, and allow faster, more strategic decision-making.
9. How often should business forecasts be updated?
Forecasts should be updated regularly, be it weekly, monthly, or in real-time, depending on the business’s needs. BI tools like Power BI and GIA enable automated updates for timely and relevant forecasting insights.
10. Can BI forecasting predict risks as well as opportunities?
Absolutely. BI forecasting not only identifies opportunities for growth but also highlights potential risks by spotting negative trends, outliers, or irregular patterns in the data, helping businesses prepare and adapt in advance.
Ready to be a
10x Marketer?
See it in action


